For tech-empowered companies, a new set of metrics are required to measure the outcome of technology investments and evaluate if the foundation is sound to enable companies to continue to evolve with technology advances. Current commonly used IT metrics won’t suffice for those companies.
When I met the CEO of a major $100+B healthcare company for the first time, he asked me these questions: “Parker, how should I think about IT? I don’t even know what metrics I should ask my CIO to measure himself, let alone for me to evaluate if the numbers are good or bad.”
Does this sound familiar? On one hand, most companies’ CEOs have realized that their industries and their companies are becoming increasingly technology-centric. On the other hand, many companies still don’t have the right set of metrics to measure the IT performance and evaluate the value that technology is creating for the companies.
Issues with Current IT Metrics
Measuring technology performance has been an evergreen problem for the last 30 years. A number of approaches have been adopted in the past:
- The Project & Program Dashboard: This approach is often used by IT executives who are experienced project and program managers. They focus on ensuring that the projects and programs finish on time and under budget. The US government’s IT dashboard (http://ITDashboard.Gov) is a good example of such dashboards.
- The CFO Budget Spreadsheet: Given that IT cost is often one of the largest expense line items in a company, many companies have focused on the cost management side of IT metrics. TBM Council (https://www.tbmcouncil.org/) has invested heavily to create a standard taxonomy for companies to effectively provide the IT cost transparency and manage the IT cost.
- The Operations Report: Companies that are focusing on IT reliability and stability often adopt this view to provide all the ins and outs of system reliability and stability information.
- The IT Balanced Scorecard: More advanced companies have tried to create their version of Balanced Scorecard to holistically assemble the above-mentioned information into an IT equivalent of Balanced Scorecard.
As technology becomes more essential in every industry and every company, and as companies become tech-empowered, the current approaches for technology metrics have a number of key challenges:
- Business Outcome linkage: The metrics are too inward-looking and reflect only IT metrics vs. holistically describe how technology is creating value for the company. While some companies may start to track the linkage between IT and strategic business initiatives, the linkage is often an artificial/reverse engineered line trying to align IT initiatives to business priorities vs. a true top-down translation of business initiatives into IT initiatives.
- Products vs. Projects/Programs: Current IT metrics approaches still center around in-flight projects and programs vs. shifting towards a product-centric view of the world.
- Evolution: Given how quickly technologies are changing, companies need to have an evolutionary platform that will allow themselves to adapt to the ever-changing technology landscape. Current metrics often don’t have indicators that measure this.
- Technology: The state of technology is actually often omitted from the various dashboards. Thus, on the one hand, the CIOs discuss the technology legacy and technology debts, but on the other hand, there is no concrete tracking of the state of the technology in most IT dashboards today.
A New Approach to Technology Metrics
Having worked with many companies in redesigning their ways of managing IT investment and management processes, and having discussed with many CEOs on how they should understand and manage technology, I’m proposing a new framework that focuses on three key areas:
- Performance: How much concrete business outcomes is technology creating concrete for the business today?
- Progress: How well is technology being deployed today?
- Foundation: How well can we adapt our technology for the future?
Let me highlight the details behind each of the categories.
The Performance category:
To make technology matter, technology must be explicitly linked with business performance metrics, e.g., revenue growth, operational efficiency gains, and customer satisfaction. This is where current IT dashboards typically lack the most since many IT executives may argue that “we are the foundation and we are not directly linked to the business performance” and don’t track such metrics. Even though some IT projects might not be directly associated with those metrics, CIOs and IT departments should still track the business performance metrics across IT so that the technology staff always keep the business outcome in mind.
The Performance metrics can be tracked in two separate categories: direct and indirect.
- Technology departments should track their direct contributions to the business performance metrics, e.g., revenue resulting from technology-enabled products. Another good direct metrics to track for technology is the unit cost of the business, e.g., cost per customer or cost per unit. Technology automation is often the best lever to improve operational efficiency and lower unit costs. Thus, tracking year-over-year unit cost decrease for technology departments can motivate the staff to continuously seek opportunities to use technology to drive business operational efficiency.
- For indirect tracking, companies should track overall revenue growth, customer satisfaction, and other important strategic metrics. This way IT can always keep the overall business priorities on top of everyone’s mind.
The Progresses category
In the Progresses category, there are three key buckets to track: Products, Problems, and Portfolio.
Products: As companies shift from project/programs to products, companies must establish a set of measures to evaluate how well the products are being developed and deployed. Key evaluation dimensions could include value (did the product investment achieve the intended outcome?), velocity (did the product development team achieve the intended time to market and get the product introduced on timet?), quality (was the product quality acceptable?), and user satisfaction (are the users satisfied with the product features and functionalities, e.g., NPS)
Problems: While the word Problem sounds negative, companies must realize that technology is both an asset but also a potential liability. When the systems fail to stay up and running, the business operations could grind to a halt. When there are information security issues, companies could lose the trust of their customers. Compliance and privacy issues will bring regulators knocking on their door. With AI, we now have a new problem of AI ethics and responsibility. Thus it’s critical for companies to establish formal metrics to measure real and potential problems and actions that are being taken to mitigate those issues.
Portfolio: Progressive companies should also track how the technology investment portfolio is shaping up. Are we investing in both strategic growth opportunities AND keeping the lights on activities? Are we investing in both mainstream technologies AND disruptive technologies? Are we investing in building new capabilities AND fixing our technology debts? A well-balanced portfolio of technology investment will enable companies to contribute to tactical and strategic business performances.
The Foundation category
For the last category, Foundation, there are three key focus areas: Platform, People, and Intellectual Property.
Platform: As Moore’s Law indicated, processor speed and capabilities will double every couple of years. Recent Stanford University research on AI indicated that AI processing speed is doubling even faster, once every 3 to 4 months. With the speed of technology advances, companies must ensure that they have the right evolutionary foundation to continue to adapt to the latest technology changes. The Platform sub-category aims to address this. Some potential evaluation metrics for Platform include
- Data quality – This is probably one of the most important questions on technology metrics today. AI, personalization, data-driven decision making, etc. must all be built on top of clean data. Companies must ask the question and measure quantitatively – Do we have the right enterprise data foundation to enable AI and data centric company management?
- Complexity – Architectural complexity is one of the biggest issues most companies face today. While the number of applications is a controversial metric, I think for most companies it is a good proxy to indicate how complex the technology landscape is.
- Reusability – Future of the business world will likely consist of a wide variety of personalized products and services. The old approach of monolithic build-from-scratch approach of applications will no longer work. Companies must launch technology platforms that will allow them to quickly configure and assemble new products and services. One of the key metrics to measure the effectiveness of such platforms is reusability. This metric will allow companies to achieve the speed to market and economy of scale.
People: Talent is probably the No.1 challenge for companies to transition to become a tech-empowered business. To solve the people challenges, companies must start by establishing universal technology proficiency across the enterprise, which is both business and IT. Senior leaders on both sides of business and technology must be fully aware of the art of the possible for technologies and drive the technology application and adoption. Training effectiveness should be measured to see if the training to raise technology proficiency is progressing according to the plan. Number of tech job openings should be tracked to indicate if the recruiting for tech talent is making progress. Tech staff satisfaction, a usual HR metric, should continue to be measured.
Intellectual Property: As we discussed in this blog (link), Proprietary Technologies are what make technology matter. Companies must consciously evaluate how well they are performing, creating competitive differentiation using technology. No. of Patents could be a good proxy to measure the advances in using technology to create intellectual property. Another good indication for the creation of proprietary technologies is companies’ overall margin improvement. Propriety technologies and Intellectual Property will in general create more competitiveness and increase the overall margin.
An illustration of the technology metrics framework is shown below:
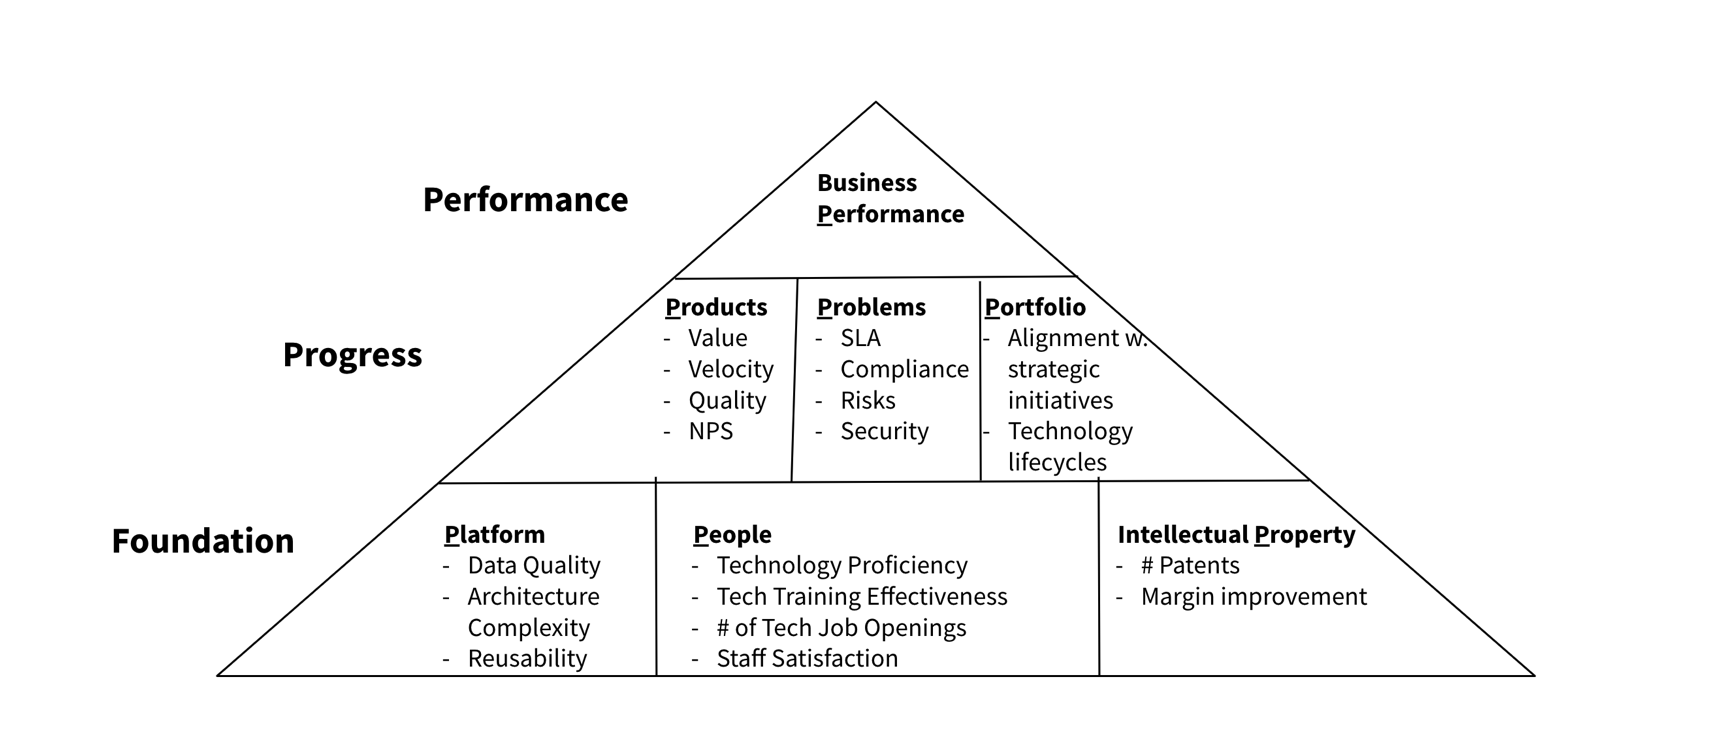
So here it is: a 7P metrics framework to evaluate IT performance and progresses, across 3 categories: Performance, Progress (Products, Problems, and Portfolio), and Foundation (Platform, People, and Intellectual Property). It will take time and effort for companies to be able to track the metrics listed in this holistic technology metrics framework. A sensible approach is to pick a couple of metrics in each bucket and start with an IT dashboard MVP (“minimum valuable product”) of 10-15 metrics. As the metrics measurement and management get mature, companies will add more metrics into this.
What do you think? Did I miss anything critical here? Please definitely reach out if you have more questions!