Only 31% of companies view themselves as data driven in 2019. According to a recent McKinsey survey, only a small fraction of the value that could be unlocked by advanced-analytics approaches has been unlocked – as little as 10 percent in some sectors. This is partially driven by the fact that many companies take a field of dreams approach to data platforms – “If you build it, he will come”. To scale the impact of data analytics across the enterprise, companies should instead adopt a flywheel approach to focus on use cases and total cost of data and analytics.
Every company today is exploring their journey to become a data driven company. Data is the new oil and no company wants to be left behind. Big Data, advanced analytics, machine learning, artificial intelligence, every business and IT executives are discussing how they want to continue to deploy data technologies and get more value out of their data.
While a lot of companies have achieved significant impact out of their data efforts, overall the journeys to unlock the value out of data is still not encouraging. Some recent analysis from a number of sources have shown sobering numbers:
- In a 2019 Harvard Business Review article, NewVantage Partners’s 2019 Big Data and AI executive Survey highlighted that the percentage of firms identifying themselves as being data-driven has actually declined from 37.1% in 2017 to 32.4% in 2018 to 31.0% in 2019.
- In a McKinsey Global Institute annual survey, McKinsey observed that only a small fraction of the value that could be unlocked by advanced-analytics approaches has been unlocked. In some sectors, the value unlocked can be as little as 10 percent.
- According to Gartner, more than half of all analytics projects fail because they aren’t completed within budget or on schedule, or because they fail to deliver the features and benefits that are optimistically agreed on at their outset.
While there are many reasons behind this, one observation that I have made over the years is that too many companies are taking a “field of dreams” approach on data infrastructure and data transformation – as Kevin Costner said in the movie: “If you build it, he will come”. Companies will invest in building data platforms such as data warehouses and data lakes and then hoping analytics will be applied and value will be generated. There are a number of challenges with this approach:
- Given that data and analytics are often siloed, there is no guarantee that data in the data platforms or infrastructure will be used. For example, Forrester (https://go.forrester.com/blogs/hadoop-is-datas-darling-for-a-reason/) reports that between 60 percent and 73 percent of all data within an enterprise goes unused for analytics. Given that some estimates indicate that 7.5 septillion (7,700,000,000,000,000,000,000) gigabytes of data are generated every single day, not using most of it is a considerable issue.
- Data in those platforms often are not complete and can’t even fulfill the basic descriptive purposes of data analytics. They are much more like “perspectives” – the analytics rely more on data analysts’ subjective opinions and interpretation.
- Furthermore, companies may even keep on adding data stovepipes vs. trying to truly treat data as an enterprise asset. Every time there is a new data technology, be it data warehouses, data marts, Hadoop data lakes, many companies will jump in and invest in that. The old technology, however, is never retired. As I told one of my clients in Minneapolis, the state of “Land of 10,000 lakes, “you are going to have 10,000 data lakes”.
- They also don’t fix the data quality issue – thus it’s garbage in, garbage out. Even when people do come, the field of data dreams is not playable.
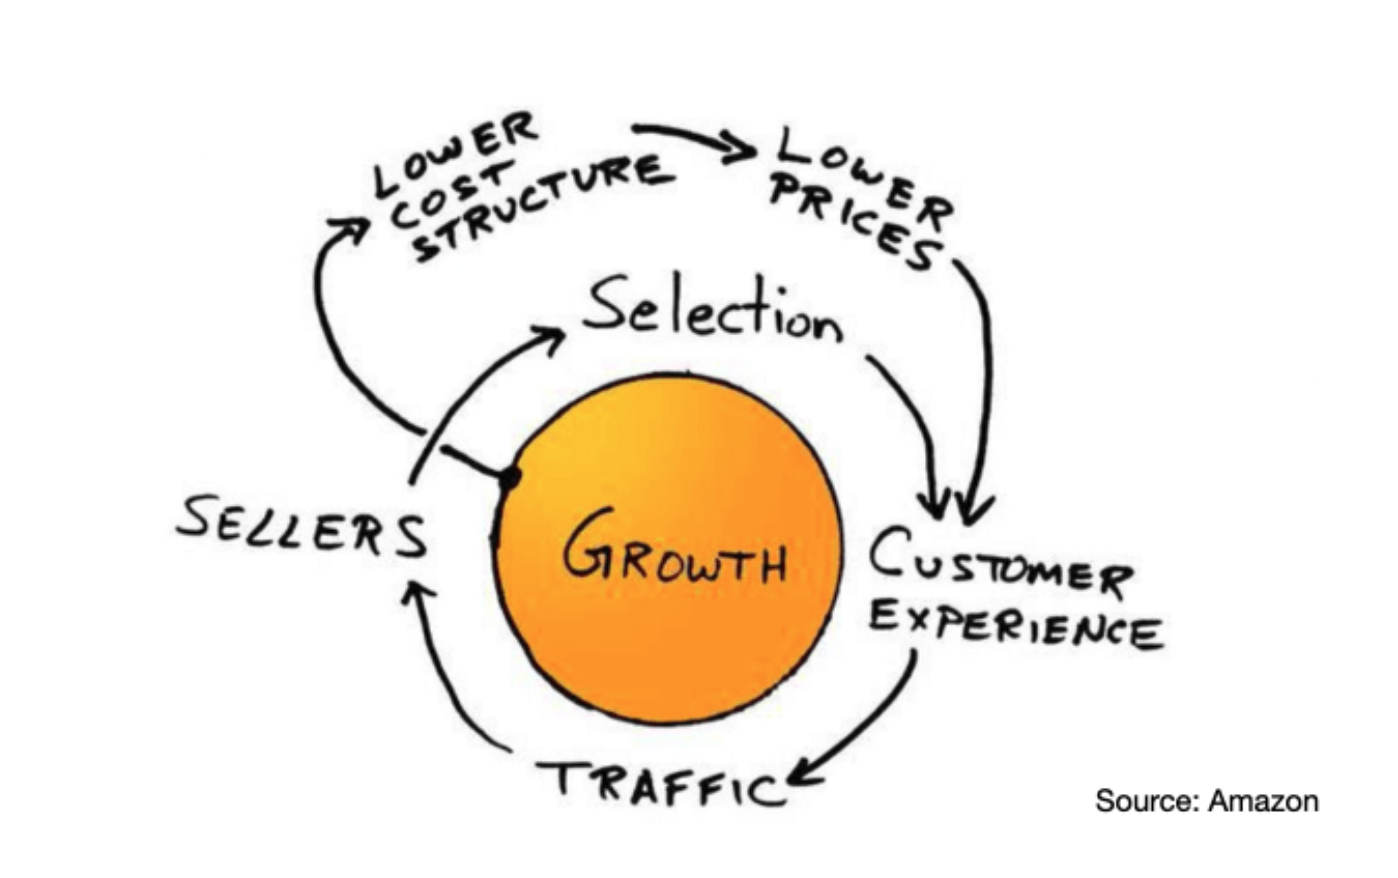
To fix the data platform, companies should learn from Amazon and try to create a flywheel effect of data value generation. As Brad Stone described from his book The Everything Store on the “discovery” of the Amazon flywheel during a company offsite in 2001:
“Bezos and his lieutenants sketched their own virtuous cycle, which they believe powered their business. It went something like this: Lower prices led to more customer visits. More customers increased the volume of sales and attracted more commission-paying third party sellers to the site. That allowed Amazon to get more out of fixed costs like the fulfillment centers and the servers they needed to run the website. This greater efficiency then enabled it to lower prices further. Feed any part of this flywheel… and it should accelerate the loop. Amazon executives were elated… after five years, they finally understood their business.”
A Flywheel approach to scale data and analytics impact
A similar flywheel approach should be established for unleashing data impact:
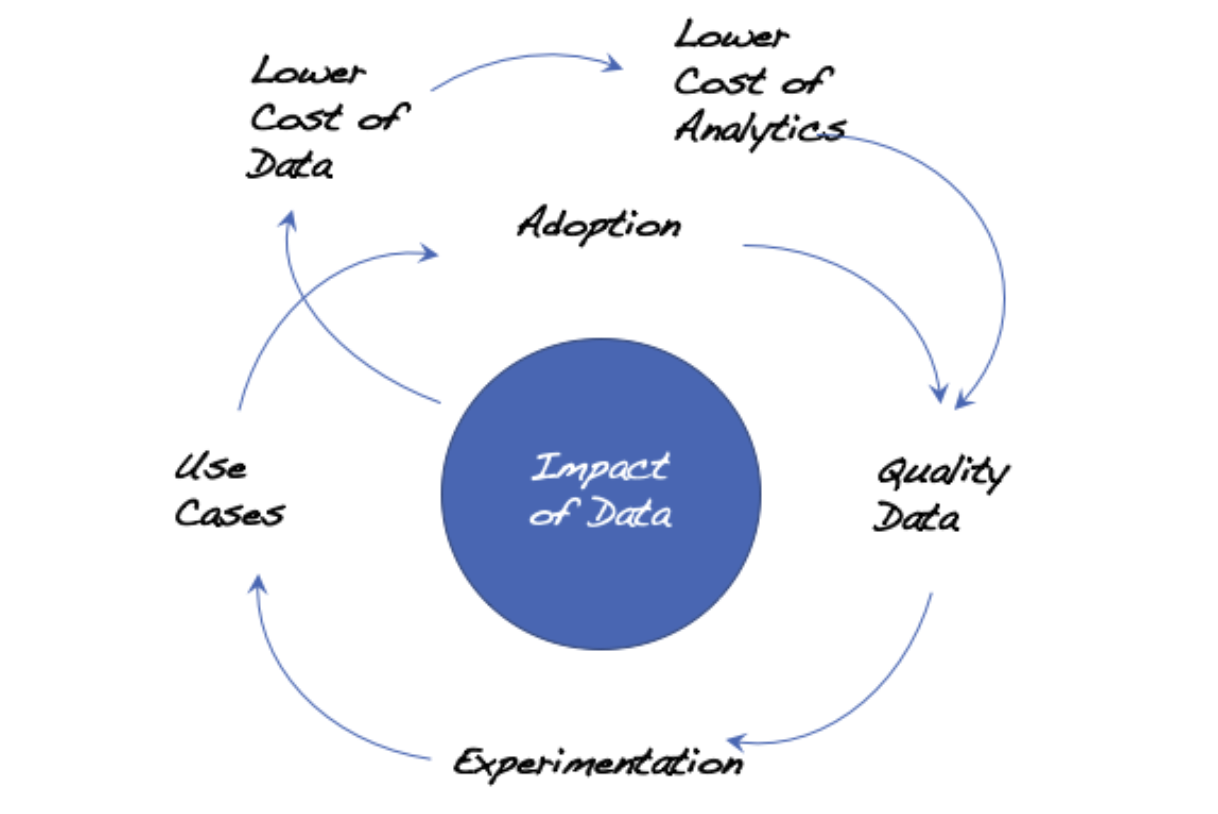
A virtuous cycle of lower cost of data and analytics would drive towards more quality data. More quality data in turn encourages more analytical experimentation which drives towards more use cases and higher adoption of analytics within a company. More use cases drive more adoption of analytics and the wider usage then generates more the need for more quality data. Similar to Amazon’s flywheel, increased data usage and analytics use cases also create more economy of scale and get more out of the fixed costs of data storage and analytics platforms. This subsequently drives down the total cost of data and analytics. This cost reduction would then allow companies to get more data at the same unit cost. Feed any part of this flywheel and it should accelerate the loop and drive bigger impact out of data.
There are a number of unique insights depicted in the data/analytics flywheel:
- Start with the value of data vs. building the “field of dreams” data platforms
Many companies got excited by the new technologies – Machine Learning, Deep Learning, Quantum Computing, Data Lakes, Cloud. Everyday there is a new technology and there is a new technology product. On many occasions, companies who jump on those technology platforms and hope to then get the value out of it would be taking the “field of dreams” approach – “let’s build it and hope they will come”. What companies should do instead, is to identify where data can generate value and impact, and then embark on those opportunities first.
As I discussed above, feed any part of the flywheel and it should accelerate the loop. Possibilities of feeding into the flywheel could be use cases, lower cost of data, adoption, or others. Companies could start with technology, but then it must be clear that the technology is going to be feeding into the flywheel, not doing technology for the sake of technology.
- Relentlessly drive down Total Cost of Data and Analytics
While there have been a lot of discussions about the value of data, there is not enough emphasis today by most companies on total cost of data and analytics. In fact, most companies will not be able to answer immediately how much they are spending on data and analytics. If we break down the cost of data and analytics, there are a number of key cost components:
- Hardware and software cost: This is probably commonly tracked by most IT organizations. Most companies would be able to provide this number.
- Business reporting cost: This covers all the manual efforts invested by people across the companies to create manual reports and consolidate numbers from Excel spreadsheets into PowerPoint. Even though every company is doing the business reporting and analytics, most companies haven’t tracked these manual efforts explicitly and won’t be able to answer the question of “how many people are working on consolidating data and generating reports and analytics everyday?”
- Enterprise summary of the cost: Given that data is likely spread out across the enterprise, it’s often difficult to create a summary view of total cost of data and analytics, across the enterprise.
Understanding the total cost of data and analytics, however, will open up a number of opportunities both on the release of data value, but also on reducing the total cost of data and analytics and self fund additional investments required to drive data value monetization. For example:
- Robotic Process Automation: Use RPA tools to automate Excel spreadsheet maintenance and consolidation. One of the banks aims to automate a whopping 9700 Excel spreadsheets using RPA.
- Offshoring and outsourcing: Routine data reporting activities can be potentially done using lower cost resources.
- Consolidation of data repositories: Data warehouses and data marts and data lakes can be potentially consolidated to reduce maintenance and support costs.
- Migration to lower cost technology: Companies should also focus on leveraging new use cases and new technologies to replace current static reports and data integration efforts and lower the total cost of analytics.
- Just-in-Time data quality improvement, driven by use cases
As I discussed in another blog on data quality, companies should adopt a just-in-time approach for data quality improvement. In the past, many companies had invested heavily on data quality initiatives. But data quality can never be perfect, and most data have shelf lives too. If there were no analytical usage of the data, the data quality improvement effort is just wasted.
Instead, companies should build analytical use cases based on existing quality data first. The value generated by the use cases will create momentum and investment to support further needs to cleanse the data.
- Democratize the access to data and encourage experimentation
While data is the new oil, unfortunately most of the oil is being wasted today. According to the NewVantage Partners research published in Harvard Business Review, an eye-opening 77% of executives report that business adoption of Big Data/AI initiatives is a major challenge.
The good news is that most companies have enough quality data for them to start doing analytics and apply the insights into improving business processes and products and services. Past process improvement techniques such as LEAN and Six Sigma can be adjusted to be more data driven. Please see my blog of the 7-step data-drive process improvement approach for more details.
Furthermore, companies should focus on establishing a foundation to enable data democratization and experimentation. Data and Analytics shouldn’t be owned and operated by Chief Information Officers, Chief Data Officers, or Chief Analytics Officers. Data should be an enterprise asset that is readily shared democratically across the enterprise. Experimenting with data analytics should be as simple as creating a pivot table in Microsoft Excel.
The good news is that the technology is much more ready than before. Platforms such as Snowflake and Amazon Redshift allow companies to quickly build Cloud based data warehouses. Tools such as Tableau enable quick and intuitive data visualization to show potential insights. Software products such as Telius and Sisense are pushing into the so-called “Augmented Analytics” field where Artificial Intelligence capabilities are automatically creating insights for data analysts’ consumption.
What companies should explore is to merge the process improvement discipline with the data and analytics tools and infrastructure and continue to push on experimentation. More experimentation will generate more use cases that create impact. The impact will in turn drive the capture of more quality data and hence virtuously more experimentation and more use cases. A flywheel!
So how can companies get started with the flywheel? My recommendation would be to start with the capture and analysis of total cost of data and analytics. This will likely free up funding to invest in newer data technology and higher quality data. Companies should then double down on a number of no-brainer use cases, coupling them with existing process improvement tools and techniques. Once the quick-win use cases generate impact, they become the catalysts for the demand for more data. Flywheel will then be rotating, non-stop!